Electronic Space Weather upper atmosphere database (eSWua) - Total Electron Content (TEC) data, version 1.0
https://doi.org/10.13127/eswua/tec
BIBLIOGRAPHIC CITATION:
COMPLETE METADATA:
Upper atmosphere physics and radiopropagation Working Group; Cesaroni, C.; Marcocci, C.; Pica, E.; Spogli, L. Electronic Space Weather Upper Atmosphere Database (eSWua) - Total Electron Content (TEC) Data, Version 1.0. Istituto Nazionale di Geofisica e Vulcanologia (INGV) August 1, 2020. https://doi.org/10.13127/ESWUA/TEC.
This collection includes the ionospheric Total Electron Content (TEC) data and products generated since 2018 by the "Upper atmosphere physics and radiopropagation" INGV group and stored into the eSWua (electronic Space Weather upper atmosphere) database.
A dedicated computational center at the INGV headquarters processes the information acquired by the INGV-RING network (http://ring.gm.ingv.it), the EUREF permanent GNSS network (http://www.epncb.oma.be) and the IGS network (http://www.igs.org) and produces, 24/7, ionospheric TEC data for the Mediterranean and European areas and for the entire globe.
These information are real-time organized by the eSWua system, which makes available to the users several TEC data and products (nowcasting and forecasting TEC maps, latitudinal/longitudinal TEC distributions, etc.) in an open format.
These data are owned by the Istituto Nazionale di Geofisica e Vulcanologia (INGV) and distributed under a Creative Commons Attribution 4.0 International (CC BY 4.0).
YOU ARE FREE TO:
Share — copy and redistribute the material in any medium or format.
Adapt — remix, transform, and build upon the material for any purpose, even commercially.
YOU MUST:
Give appropriate credit by using the provided citation.
DISCLAIMER:
Any risk due to improper use of these data falls under the responsibility of the individual user. In no case and way INGV will be responsible for direct, indirect, voluntary or accidental damages, including lost profits, deriving from the use of the data even if INGV was advised of this possibility.
DATA ACCESS:
Open the "Download tool" page to retrieve the data with the guided procedure
Open the eSWua Web-service guide for adavanced data access
Map of the station and historical data availability
Based on the real-time GNSS data from the
RING network broadcasted via NTRIP,
ionospheric vTEC maps are estimated every 10 minutes on 0.1 deg x 0.1 deg grid. The
vTEC estimated at the ionospheric piercing point are interpolated using locally
(weighted) regression scatter plot smoothing (LOWESS). No ionospheric input model is
ingested to better highlight the ionospheric irregularities.
Based on nowcasting TEC maps over Mediterranean area provided by INGV,
forecasting vTEC maps over Mediterranean area are estimated
30 minutes in advance every 10 minutes on 0.1 deg x0.1 deg grid. Forecasting is based on
linear trend for each grid point calculated considered vTEC values of the hour.
Based on the real-time GNSS data from the
EUREF network broadcasted via NTRIP, ionospheric VTEC maps gradients (East direction) are estimated every 5 minutes on 0.5 deg x0.5 deg grid. The VTEC estimated at the ionospheric piercing point are interpolated using Locally (weighted) regression scatter plot smoothing (LOWESS). No ionospheric input model is ingested to better highlight the ionospheric irregularities. Starting from vTEC maps, gradients are estimated evaluating the first derivative of the vTEC along N-S and E-W geographical directions.
TEC Global nowcasting is based on data from
IGS stations ingested into NeQuick2 model. In particular, differences between measured and modelled TEC are computed at each IPP in order to create a global map representing the differences among actual and modelled TEC distribution. Such map is added to the map calculated by running NeQuick2 in order to obtain the TEC nowcasting.
Based on auto regressive neural network with external input (forecasted Kp from NOAA) and ingestion of IGS GIM maps on NeQuick2 model, vTEC at a global level is estimated 24 hours in advance every 2 hours on a grid 2.5deg X 5 deg (lat x long).
For details please refer to Cesaroni, C., Spogli, L., Aragon-Angel, A., Fiocca, M., Dear, V., De Franceschi, G., & Romano, V. (2020). Neural network based model for global Total Electron Content forecasting. Journal of Space Weather and Space Climate.
Coverage: Global 180W-180E ;87.5S-87.5N
Resolution: 2.5 degree x 2.5 degree.
TIME ASPECT:
Update Rate: 2 h
Latency: 10 min
Integration Time: 1 y
Predicted Time: 24 h
DATA GLOSSARY
A
B
C
D
E
F
1
FIELD NAME
DESCRIPTION
MEASUREMENT UNIT
TYPE
RELATED TO DATA
ELABORATION LEVEL
2
jfile
TEC maps
TECu
points matrix (latitudes / longitudes coordinates with TEC values)
nc_med, sf_med, nc_eu, nc_gl, ltf_gl
LEVEL-I
3
dt
measurement time UTC
timestamp
single value
nc_med, sf_med, nc_eu, nc_gl, ltf_gl
LEVEL-I
4
f_horizon
forecasting horizon
hours
single value
ltf_gl
LEVEL-I
5
r12_eff
effective R12 (to be used in NeQuick2 model)
adimnsional
single value
ltf_gl
LEVEL-I
6
refresh_rate
TEC value UPDATE RATE
min
single value
nc_med, sf_med, nc_eu, nc_gl, ltf_gl
LEVEL-I
7
rgec_mean
mean Residual Global Electron Content
TECu
single value
ltf_gl
LEVEL-I
8
rgec_std
standard deviation Residual Global Electron Content
TECu
single value
ltf_gl
LEVEL-I
9
tec_mean
mean TEC over area
TECu
single value
nc_med, sf_med, nc_eu, nc_gl, ltf_gl
LEVEL-I
10
tec_std
TEC standard deviation
TECu
single value
nc_med, sf_med, nc_eu, nc_gl, ltf_gl
LEVEL-I
10
tec_med_27_days
27 days median of the tec_mean
TECu
single value
nc_med, sf_med, nc_eu, nc_gl, ltf_gl
LEVEL-I
DATA DISTRIBUTION FORMAT:
The data on the eSWua website are distributed in JSON format. In a nutshell, a JSON is written as key/value pairs. A key/value pair consists of a field name (the key, representing a property or a parameter), followed by a colon, followed by its value.
A JSON file is easy to read (human readable) and simple to manage and consume by most of the common scientific programming languages (machine readable).
Further information on JSON format may be found here.
Extract of a JSON file containing TEC map values: in the example two point of a TEC map are listed (latitude, longitude and the TEC value):
REAL TIME TEC:
In this page is provided an overview of the latest TEC data (last TEC map, mean TEC and hourly mean TEC time-series) over the choosed area (Mediterranean, Europe, World). Latest forecast map are also shown when available.
TEC MAPS EXPLORER:
In this page it's possible to plot a series of TEC maps for a chosen time period and area (Mediterranean, Europe, World). When the associated forecasted map is available, a link to the map will be provovided
TEC DATA EXPLORER:
In this page it's possible to plot specific TEC data (both hisotrical and near-real time). In particular it’s possible to plot the mean TEC/TEC deviation time-series, the hourly TEC mean and the Latitudinal/Longitudinal distribution of TEC. Multiple plots can be added to the page, allowing the comparison among different areas/time-periods.
TEC DATA KEOGRAMS:
In this page it's possible to plot the Keograms of the TEC data in each area of interest (Mediterranean, Europe, World). Multiple plots can be added to the page, allowing the comparison among different areas/time-periods.
DATA COMPARISON (MAIN MENU): This page groups togheter the 'parameters explorer tool' of each eSWua data-collection (GNSS SCINTILLATION, HF SYSTEM, GNSS TEC), allowing comparisons of the observations acquired from different sources/instruments. You can use the buttons to add one or multiple plots for each data-source.
NAVIGATION
SETTING ITEM
KIND
ROLE/USE
ACTION
SELECT STATION:
SELECT AREA:
SELECT MAP PRODUCT:
single-choise drop-down-menu
Switch station/area/product among the available ones.
On item selection: submission and reloading of the page.
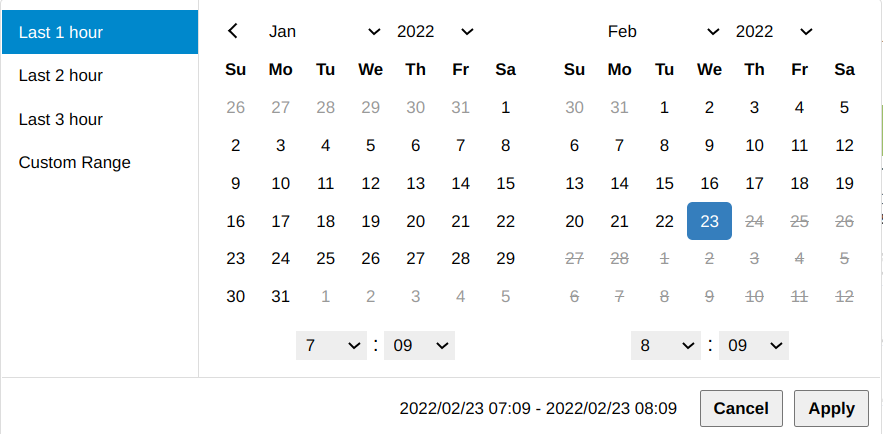
TIME RANGE (UTC):
timepicker
Role: Set time/time-interval of interest.
Use: Click to open the timepicker. Use the left column if
you want to use predefined time intervals, otherwise use the calendar
to specify a custom interval:
(1) On the top you
can use the arrow to navigate between consecutive months and the box to set the
year and month. (2) On the monthly calendar click once on the start day and once
on the end day (if start and end day are the same click two times on
the same day) (3) Set start and end hours in the bottom boxes
(4) Click on Apply to set your choice.
When other filter are available in the page you must click on the "APPLY
FILTERS" button to submit your choise and reload the page.
When no other filter are present, page will be reloaded once click on the "Apply" button INSIDE the timepicker windows.
NOTES:
-The minimum year that can be set on the timepicker will vary accordingly to the specific station/area choosed.
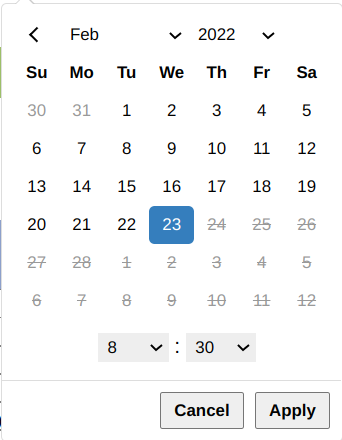
INSERT TIME (UTC):
timepicker
Role: set a specific time-instant. It apply only for the IONOSPHERIC MAP page.
Use:
click on the box to open the timepicker. (1) On the top
you can set the year and month. (2) Set the day of the
month in the calendar. (3) Set the hour and minute in the
boxes at the bottom (4) Click on the Apply button to
confirm your choice.
On-click on the timepicker "Apply" button: submission and reloading of the page.
NOTES:
-The minimum year that can be set on the timepicker will vary accordingly to the specific map choosed.
FILTER SPECIFIC INSTANT:
timepicker
Role:
set a specific instant of the day for which the plots inside the choosed "Time range" interval will be displayed. It apply only for the VERTICAL SOUNDING EXPLORER/TEC MAP EXPLORER pages.
Use: (1) Firstly you need to set the "Time range" (see related element) of interest. (2) Click on the "filter specific instant" box and
choose a time-item from the available ones.
Click the button "APPLY FILTERS" to submit your settings and reloading
the page.
PARAMETERS:
multiple-choise drop-down-menu
Role:
It allow to set or remove one or multiple parameter. If more than one parameter is set, each parameter
will be displayed in different plots.
Click the button "APPLY FILTERS" to submit your choise and reload
the page.
ELEVATION MASK:
single-choise drop-down-menu
Role:
It allows to set an elevation mask. Only satellites above that value will be displayed
in each plot.It apply only for the GNSS scintillation data.
Click the button "APPLY FILTERS" to submit your settings and
reload the page.
CONSTELLATION:
multiple-choise drop-down-menu
Role:
It allow to add or remove specific constellation.Only satellites of those constellation
will be displayed. It apply only for the GNSS scintillation data. The dafault value ("ALL") will
display all the available constellations, you have to remove it if specific constellation are set.
Click the button "APPLY FILTERS" to submit your settings and
reload the page.
SELECT LONGITUDE:
SELECT LATITUDE:
single/multiple-choise drop-down-menu
Role:
It allow to set single/multiple
longitude/latitude for wich the data will be
displayed. If multiple value are selected, different traces will be displayed on the same plot. It apply only for the TEC data.
Click the button "APPLY FILTERS" to submit your settings and
reload the page.
button
Role: submission of all the configuration filters.
On click: submission and reload of the page.
button
Role: reset to the default setup of the configuration filters.
On click: reload of the page.
button
Role:
It adds another plot at the
bottom of the page.
On click: reload of the page.
button
Role: It removes all the plots added with the "ADD PLOT" button. Only the first plot will be displayed.
On click: reload of the page.
LINK THE PARAMETERS OF THE FIRST STATION BETWEEN ALL THE PLOTS
slider
Role:
It will appear when more than 1 plot is displayed in the page. (1) When enabled, it will link all
the settings of the first plot (time-range, parameters, etc.) to the other plots on the page.
Only the "Select station" element can be changed on the other plots. (2) When disabled,
all the settings will appear again in each plot of the page.
On click: reloading of the page.
button
Role:
It open the citation for the data displayed on the page.
On click: display text box.
button
Role:
It open the data info page for the related data-collection.
On click: open another windows.
button
Role:
It open the page to explore the hostorical availability of the data.
On click: open another windows.
PLOT TOOLS
ELEMENT
NAME
ROLE/USE
zoom
It allows to select the area of the image that will be zoomed. (tips: zoom-in enabled also by left-click and drop on the plot. Double left click to zoom-out).
zoom in / zoom out
It allows to zoom in/out in the image.(tips: enabled also by mouse-scroll on a map).
pan
It allows to drag-and-drop the plot to navigate through it.
reset axis
It will restore the original view of the plot.
LEGEND TIPS
Tips: double left-click on item of the legend will display (isolate) only that specific trace/points. Double left-click will restore
the view with all the traces.
ctrl+left-click on items of the legend will add/remove single traces/points to the plot. Double left-click will restore the view with all the traces